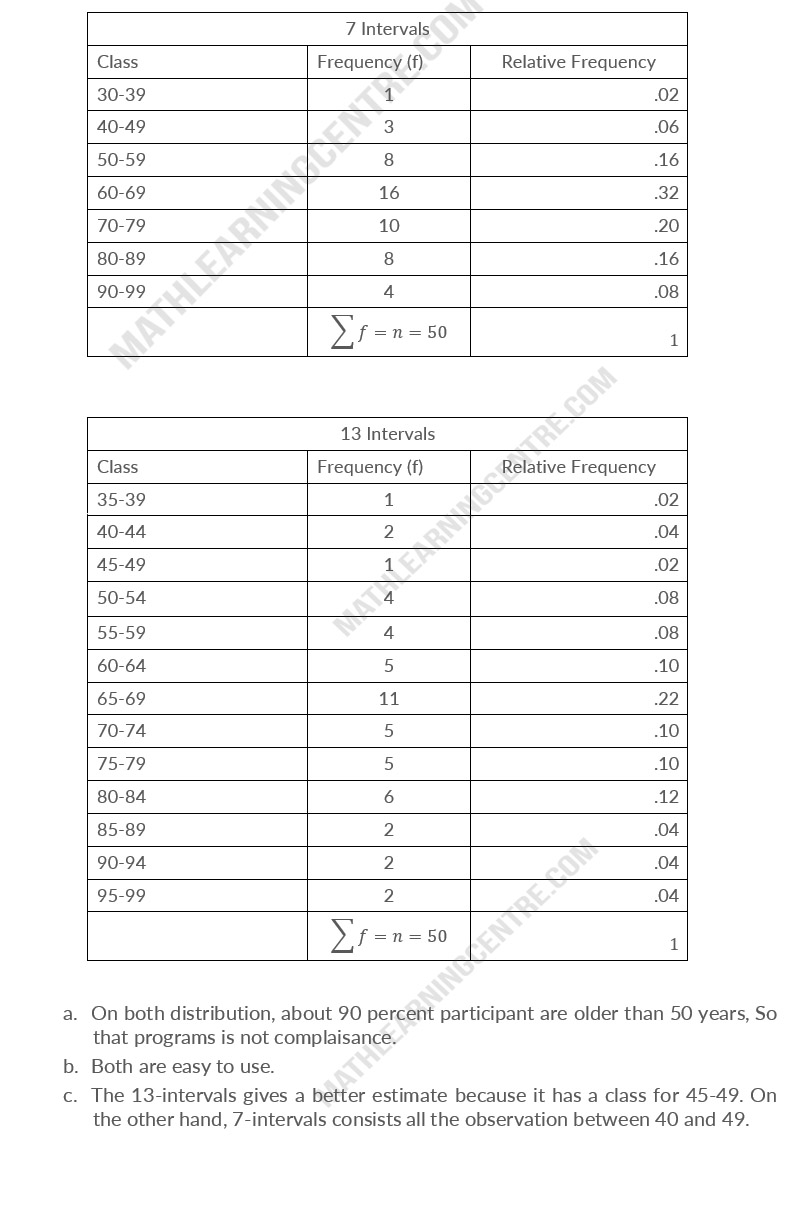
Here the ages of 50 members of a county social service program
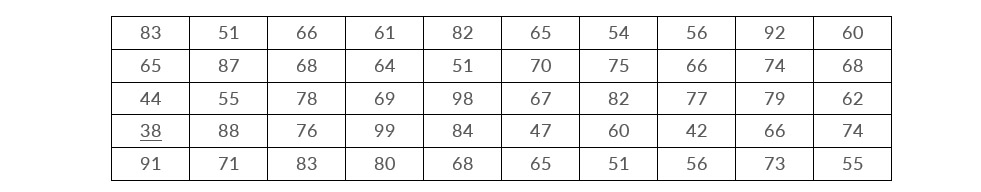
Use these data to construct relative frequency distributions using 7 equal intervals and 13 equal intervals. State policies on social service programs require that approximately 50 percent of the program participants be older than 50.
- Is the program in compliance with the policy?
- Does your 13-interval relative frequency distribution help you answer part (a) better than your 7-interval distribution?
- Suppose the Director of Social Services wanted to know the proportion of program participants between 45 and 50 years old. Could you estimate the answer for her better with a 7- or a 13-interval relative frequency distribution?
Solution