Here the ages of 50 members of a county social service program
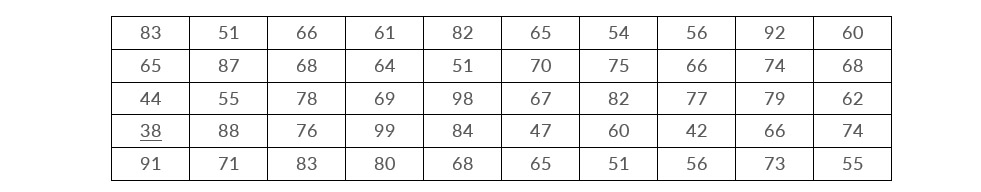
Use these data to construct relative frequency distributions using 7 equal intervals and 13 equal intervals. State policies on social service programs require that approximately 50 percent of the program participants be older than 50.
- Is the program in compliance with the policy?
- Does your 13-interval relative frequency distribution help you answer part (a) better than your 7-interval distribution?
- Suppose the Director of Social Services wanted to know the proportion of program participants between 45 and 50 years old. Could you estimate the answer for her better with a 7- or a 13-interval relative frequency distribution?
Read more: Problem-01: Grouping and Displaying data to convey meaning
| TABLE: HIGH SCHOOL AND COLLEGE GRADE-POINT AVERAGES OF 20 COLLEGE SENIORS | |||||||
| H.S. | College | H.S. | College | H.S. | College | H.S. | College |
| 3.6 | 2.5 | 3.5 | 3.6 | 3.4 | 3.6 | 2.2 | 2.8 |
| 2.6 | 2.7 | 3.5 | 3.8 | 2.9 | 3.0 | 3.4 | 3.4 |
| 2.7 | 2.2 | 2.2 | 3.5 | 3.9 | 4.0 | 3.6 | 3.0 |
| 3.7 | 3.2 | 3.9 | 3.7 | 3.2 | 3.5 | 2.6 | 1.9 |
| 4.0 | 3.8 | 4.0 | 3.9 | 2.1 | 2.5 | 2.4 | 3.2 |
Arrange the data in an array from highest to lowest high school GPA. Now arrange the data in an array from highest to lowest college GPA. What can you conclude from the two arrays that you could not from the original data?
Read more: Problem-02: Grouping and Displaying data to convey meaning
Transmission Fix-It stores recorded the number of service tickets submitted by each of its 20 stores last month as follows:
The Company believes that a store cannot really hope to break even financially with fewer than 475 service actions a month. It is also company policy to give a financial bonus to any store manager who generates more than 725 service actions a month. Arrange these data in a data array and indicate how many stores are not breaking even and how many are to get bonuses.
Read more: Problem-03: Grouping and Displaying data to convey meaning
Use the data from transmission Fix-It as follows
The company financial VP has set up what she calls a "store watch list", that is , a list of the stores whose service activity is low enough to warrant additional attention from the home office. This Category includes stores whose service activity is between 550 and 650 service actions a month. How many stores should be on that list based on last month's activity?
Read more: Problem-04: Grouping and Displaying data to convey meaning
The number of hours taken by transmission mechanics to remove, repair and replace transmissions in one of the Transmission Fix. It stores one day last week is recorded as follows:
| 4.3 | 2.7 | 3.8 | 2.2 | 3.4 |
| 3.1 | 4.5 | 2.6 | 5.5 | 3.2 |
| 6.6 | 2.0 | 4.4 | 2.1 | 3.3 |
| 6.3 | 6.7 | 5.9 | 4.1 | 3.7 |
Construct a frequency distribution with intervals of 1.0 hour from these data. What conclusions can you reach about the productivity of mechanics from this distribution? If Transmission Fix-It management believes that more than 6.0 hours is evidence of unsatisfactory performance, does it have a major or minor problem with performance in this particular store?
Read more: Problem-05: Grouping and Displaying data to convey meaning
The orange County Transportation Commission is concerned about the speed motorists are driving on a section of the main highway. Here are the Speed of 458 motorists:
| 15 | 32 | 45 | 46 | 42 | 39 | 68 | 47 | 18 |
| 31 | 48 | 49 | 56 | 52 | 39 | 48 | 69 | 61 |
| 44 | 42 | 38 | 52 | 55 | 58 | 62 | 58 | 48 |
| 56 | 58 | 48 | 47 | 52 | 37 | 64 | 29 | 55 |
| 38 | 29 | 62 | 49 | 69 | 18 | 61 | 55 | 49 |
Use these data to construct relative frequency distributions using 5 equal intervals and 11 equal intervals. The U.S. Department of Transportation reports that, nationally, no more than 10 percent of the motorists exceed 55 mph.
- Do Orange County motorists follow the U.S. DOT’s report about national driving patterns?
- Which distribution did you use to answer part (a)?
- The U.S. DOT has determined that the safest speed for this highway is more than 36 but less than 59 mph. What proportion of the motorists drive within this range? Which distribution helped you answer this question?
Read more: Problem-06: Grouping and Displaying data to convey meaning
| POUNDS OF PRESSURE PER SQUARE INCH THAT CONCRETE CAN WITHSTAND | |||||||
| 2500.2 | 2497.8 | 2496.9 | 2500.8 | 2491.6 | 2503.7 | 2501.3 | 2500.0 |
| 2500.8 | 2502.5 | 2503.2 | 2496.9 | 2495.3 | 2497.1 | 2499.7 | 2505.0 |
| 2490.5 | 2504.1 | 2508.2 | 2500.8 | 2502.2 | 2508.1 | 2493.8 | 2497.8 |
| 2499.2 | 2498.3 | 2496.7 | 2490.4 | 2493.4 | 2500.7 | 2502.0 | 2502.5 |
| 2506.4 | 2499.9 | 2508.4 | 2502.3 | 2491.3 | 2509.5 | 2498.4 | 2498.1 |
Arrange the data in an array from highest to lowest.
- Suppose that state law requires bridge concrete to withstand at least 2,500 lb/sq in. How many samples would fail this test?
- How many samples could withstand a pressure of at least 2,497 lb/sq in. but could not withstand a pressure greater than 2,504 lb/sq in.?
- As you examine the array, you should notice that some samples can withstand identical amounts of pressure. List these pressures and the number of samples that can withstand each amount.
Read more: Problem-07: Grouping and Displaying data to convey meaning
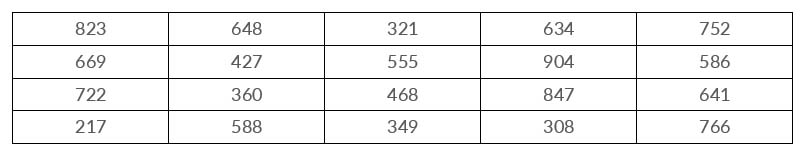
A recent concerning the habits of U.S. cable television consumers produced the following data.
Read more: Problem-08: Grouping and Displaying data to convey meaning
The Environmental protection Agency took water Samples from 12 different rivers and streams that feed into lake Erie. These Samples were tested in the EPA laboratory and rated as to the amount of solid pollution suspended in each Sample. The results of the testing are given in the following table:
Read more: Problem-09: Grouping and Displaying data to convey meaning
Suppose that the admissions staff mentioned in the discussions of table 2-1 wishes to examine the relationship between a student differential on the collage SAT examination .
Read more: Problem-10: Grouping and Displaying data to convey meaning

Minhajur Rahaman
