The orange County Transportation Commission is concerned about the speed motorists are driving on a section of the main highway. Here are the Speed of 458 motorists:
| 15 | 32 | 45 | 46 | 42 | 39 | 68 | 47 | 18 |
| 31 | 48 | 49 | 56 | 52 | 39 | 48 | 69 | 61 |
| 44 | 42 | 38 | 52 | 55 | 58 | 62 | 58 | 48 |
| 56 | 58 | 48 | 47 | 52 | 37 | 64 | 29 | 55 |
| 38 | 29 | 62 | 49 | 69 | 18 | 61 | 55 | 49 |
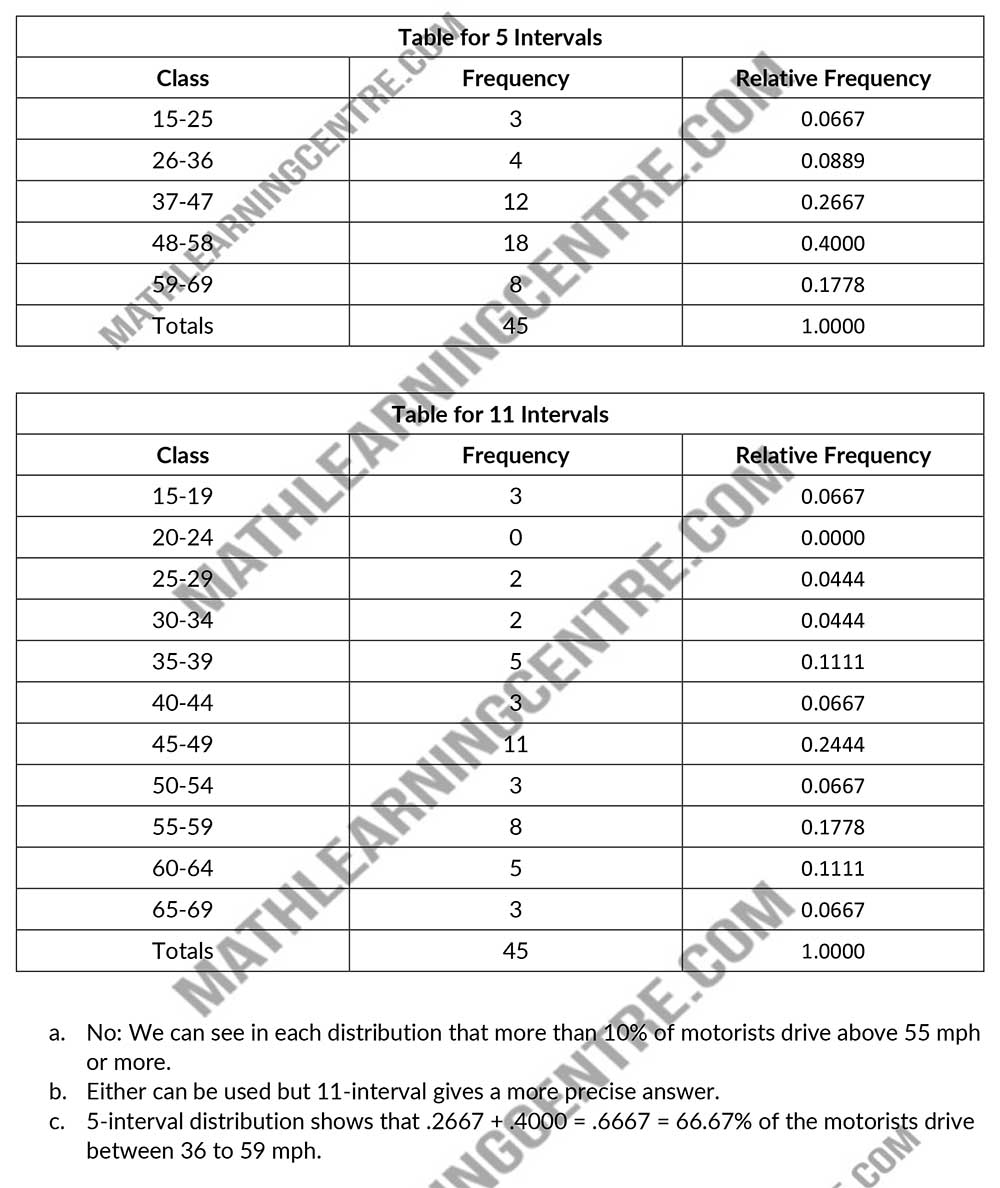
Use these data to construct relative frequency distributions using 5 equal intervals and 11 equal intervals. The U.S. Department of Transportation reports that, nationally, no more than 10 percent of the motorists exceed 55 mph.
- Do Orange County motorists follow the U.S. DOT’s report about national driving patterns?
- Which distribution did you use to answer part (a)?
- The U.S. DOT has determined that the safest speed for this highway is more than 36 but less than 59 mph. What proportion of the motorists drive within this range? Which distribution helped you answer this question?
Solutions