Universal Burger is concerned about product waste, so they sampled their burger waste record from the past year with the following results.
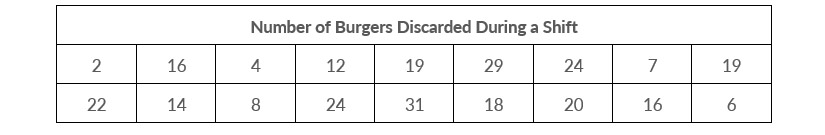
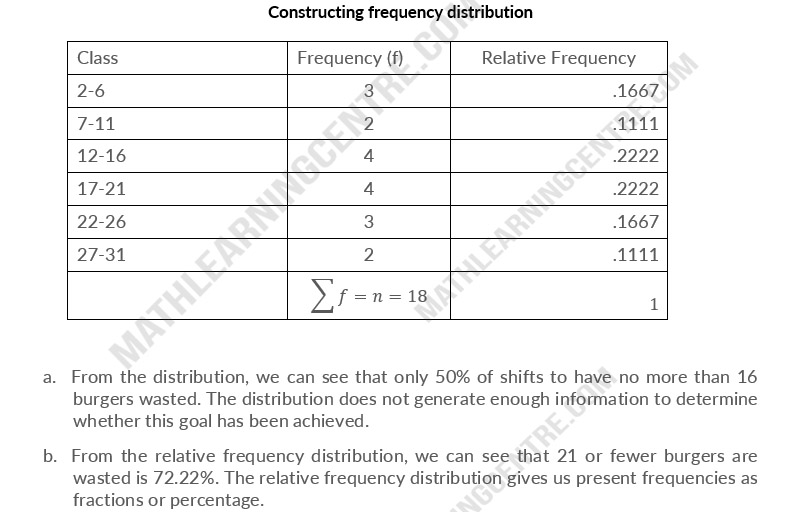
Construct a frequency distribution for these data and a relative frequency distribution. use intervals of 5 burgers.
- One of Universal burger's goals is for at least 75 percent of shifts to have no more than 16 burgers wasted. Can you determine from the frequency distribution whether this goal has been achieved?
- What percentage of shifts have wsate of 21 or fewer burgers? Which distribution did you use to determine your answer?
Solution