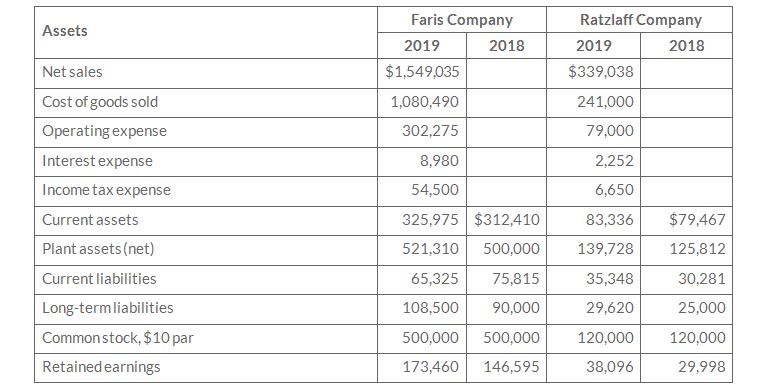
Comparative statement data for Farris Company and Raizlaff Company, two competitors, appear below. All balance sheet data are as of December 31, 2019, and December 31, 2018
Instructions
- Prepare a vertical analysis of the 2019 income statement data for Farris company and Ratzlaff Company in columnar form
- Comment on the relative profitablity of the companies by return on assets and the return on common stockholder's equity for both companies
The comparative statements of Painter Tool Company are presented below
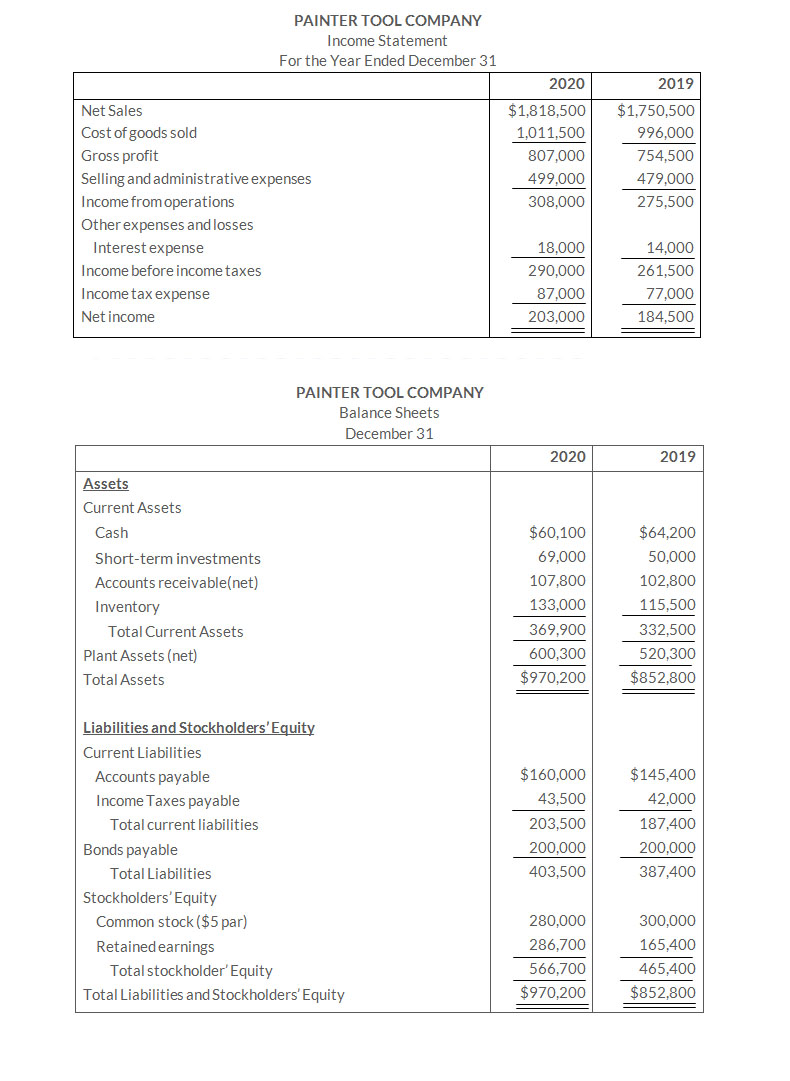
All sales were on account.
Instructions
Compute the following ratios for 2020. (Weighted-average common shares in 2020 were 57,000.)
- Earnings per share
- Return on common stockholder' equity
- Return on assets
- Current ratio
- Acid-test ratio
- Accounts receivable turnover
- Inventory turnover
- Times interest earned
- Asset turnover.
- Debt to assets ratio
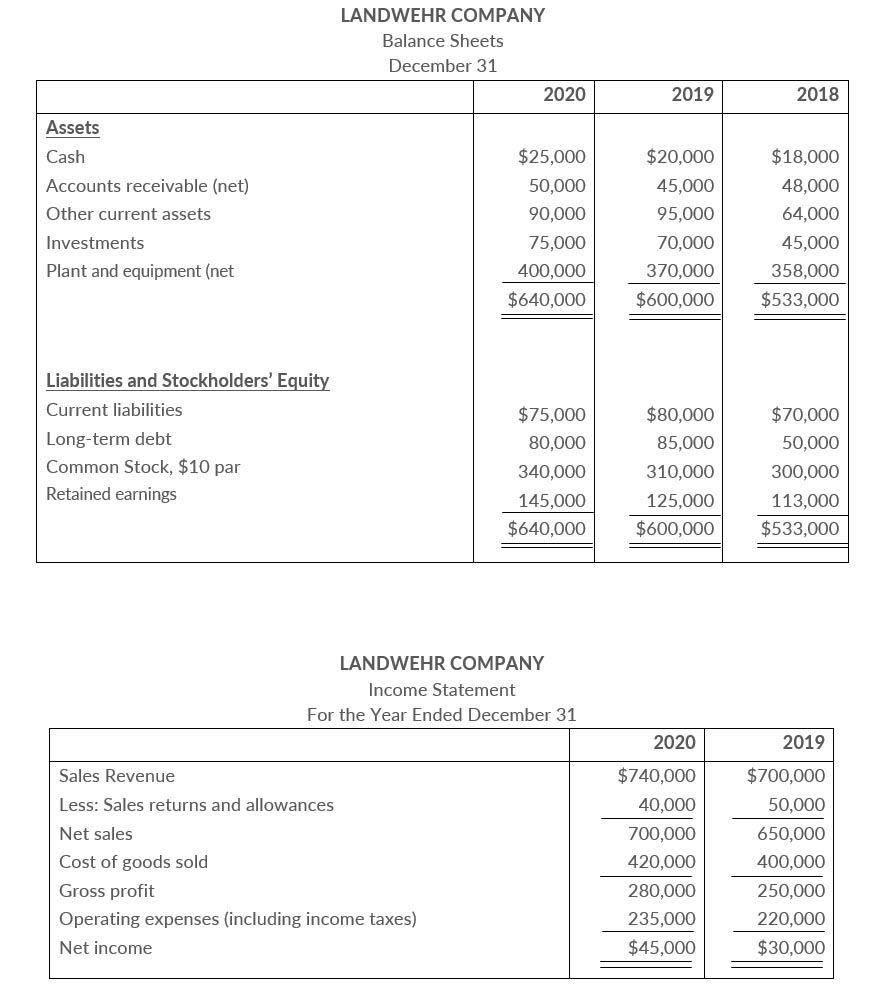
Condensed balance sheet and income statement data for Landwehr Corporation appear below.
Additional Information
- The market price of Landwehr's common stock was $4.00, $5,00, and $8,00 for 2018, 2019, and 2020, respectively.
- All Dividends wer paid in cash
Instructions
- Compute the following ratios for 2019, and 2020.
- Profit margin.
- Asset turnover.
- Earnings per share (Weighted average common shares in 2020 were 32,000 and in 2019 were 31,000.)
- Price-earning ratio.
- Payout ratio..
- Debt to assets ratio.
- Based on the ratios calculated, discuss briefly the improvement or lack thereof in financial position and operating results from 2019 to 2018 of Landwehr Corporation.
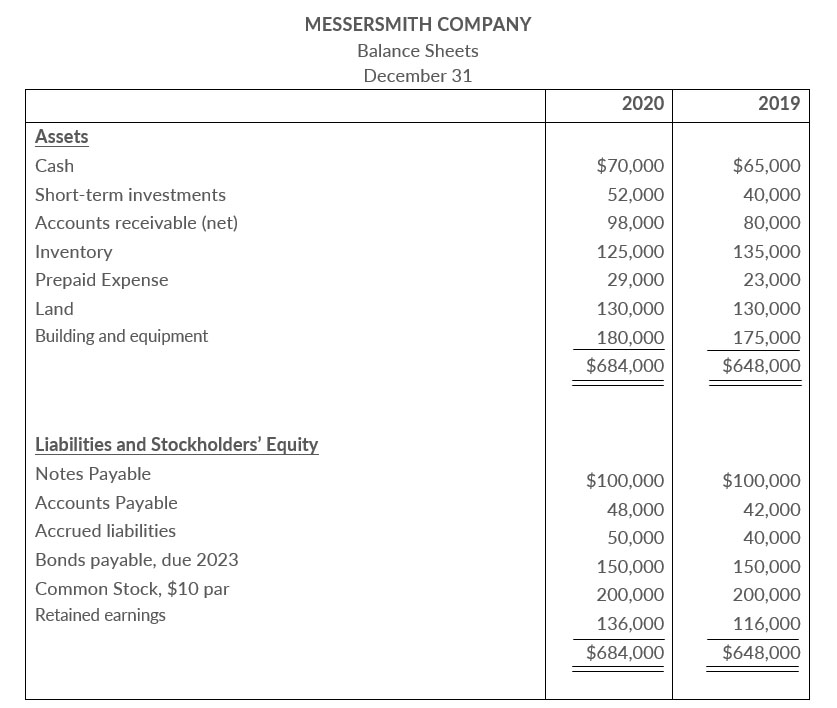
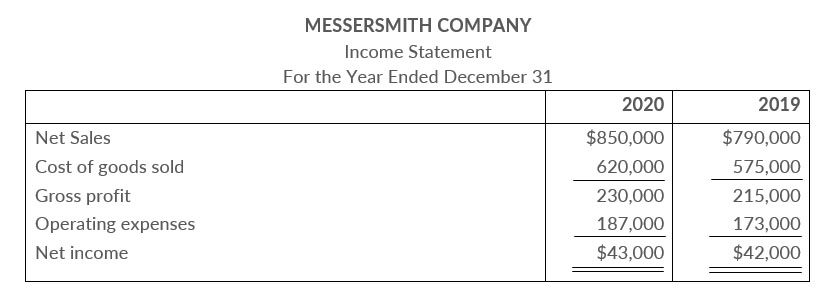
Financial information for Messersmith Company is presented below
Additional Information
- Inventory at the beginning of 2019 was $118,000
- Total Assets at the beginning of 2019 were $630,000.
- No common stock transactions occurred during 2019 or 2020
- All sales wer on account. Accounts receivable, net at the beginning of 2019, were $88,000.
- Notes payable are classified as current liabilities.
Instructions
- Indicate, by using ratios, the change in liquidity and profitability of Meassersmith Company from 2019 to 2020.
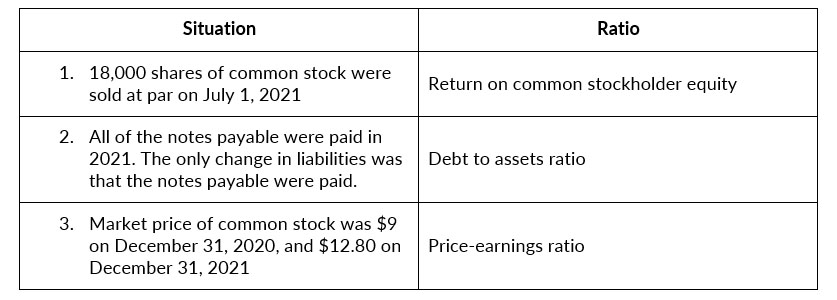
- Given below are theree independent situation and a ratio that may be affected. For each situation, compute the affected ratio (1) as of December 31, 2020, and (2) as of December 31, 2021, after giving effect to the situation. Net income for 2021 was $50,000. Total assets on December 31, 2021, were $700,000
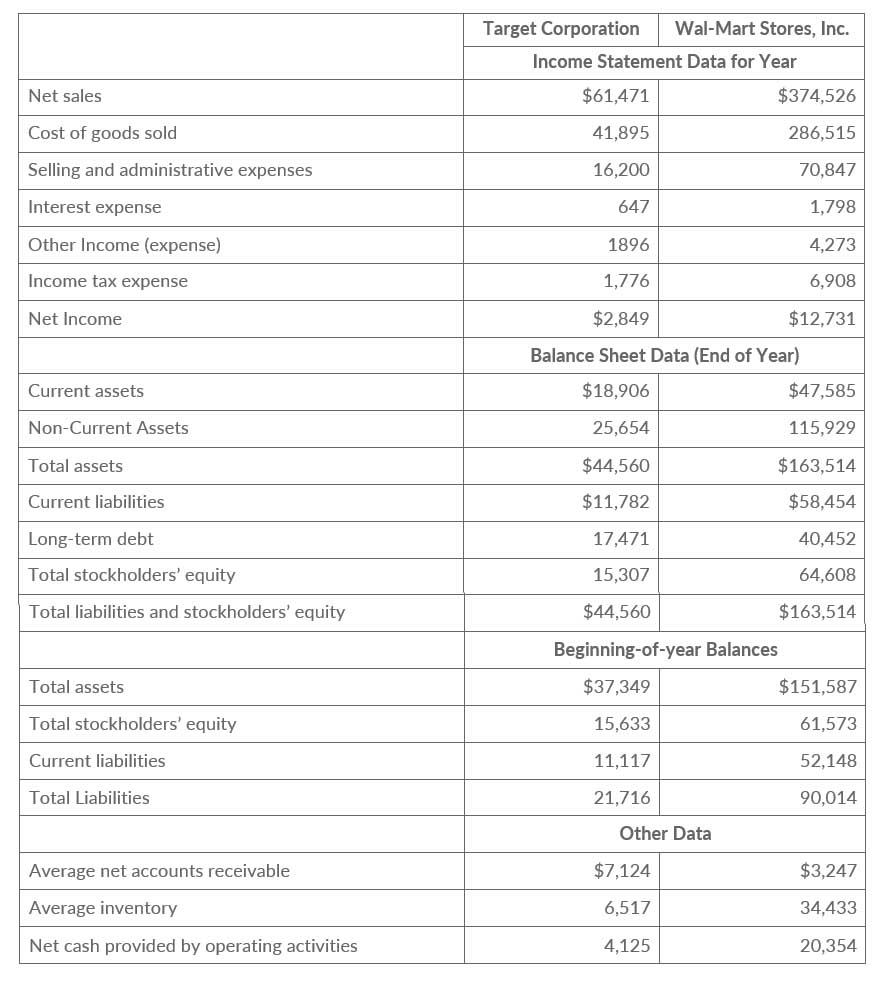
Selected financial data of Target Corporation and Wal-Mart Stores, Inc. for a recent year are presented here (in millions)
Instructions
- For each company, compute the following ratios.
- Current.
- Receivables turnover.
- Average collection period.
- Inventory turnover.
- Days in inventory.
- Profit margin.
- Asset turnover.
- Return on assets.
- Return on common stockholders' equity.
- Debt to total assets.
- Times interest earned.
- Compare the liquidity, profitability, and solvency of the two companies.
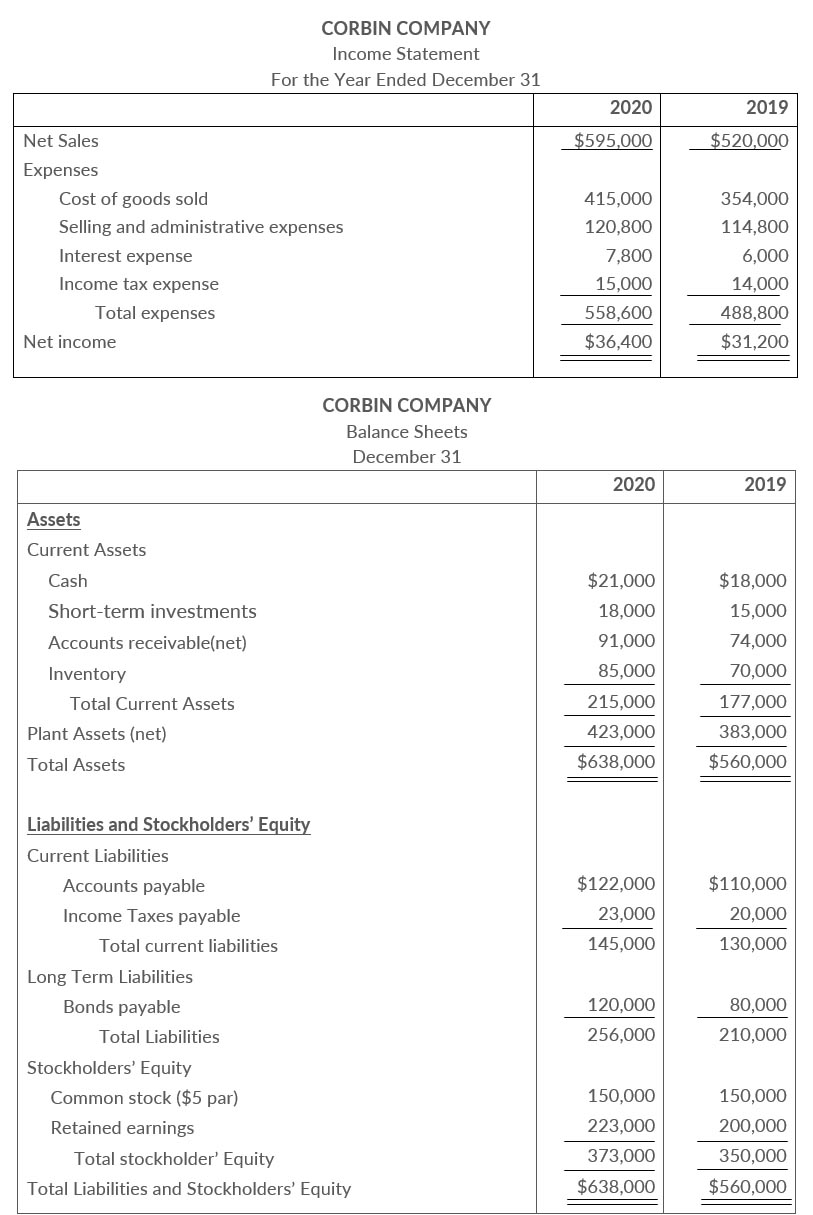
The comparative statements of Corbin Company are presented below and on Compute numerous rations.
Additional data
The common stock recently sold at $19.50 per share
Instructions
Compute the following ratios for 2020.- Current.Ratio
- Acid-Test Ratio
- Accounts Receivables turnover.
- Profit margin.
- Asset turnover.
- Return on assets.
- Return on common stockholders' equity.
- Earning Per share
- Price-earning ratio.
- Payout ratio
- Debt to total assets.
- Times interest earned.
An incomplete income statement and an incomplete comparative balance sheet of Deines Corporation are presented below.
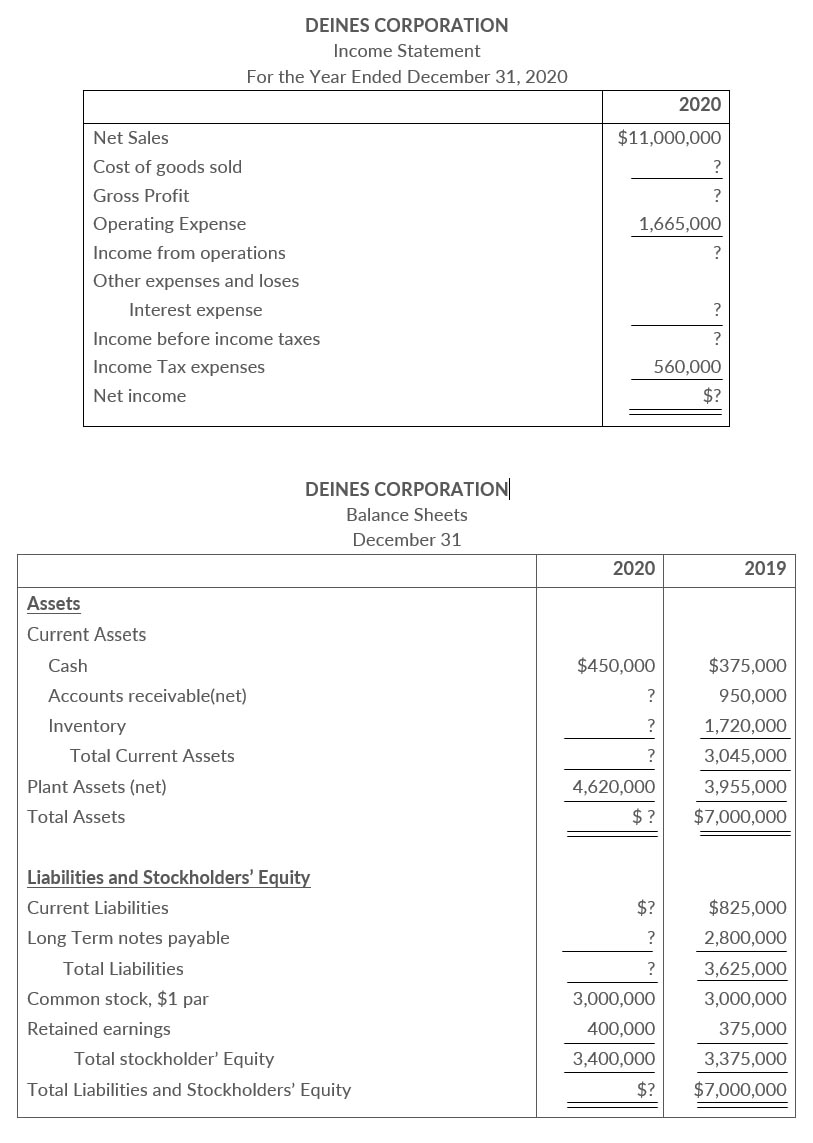
Additional information:
- The accounts receivable turnover for 2020 is 10 times
- All sales are on account.
- The profit margin for 2020 is 14.5%.
- Return on assets is 22% for 2020.
- The current ratio on December 31, 2020 is 3.0
- The inventory turnover for 2020 is 4.8 times
Instructions
Compute thee missing information given the ratios above. Show computations.
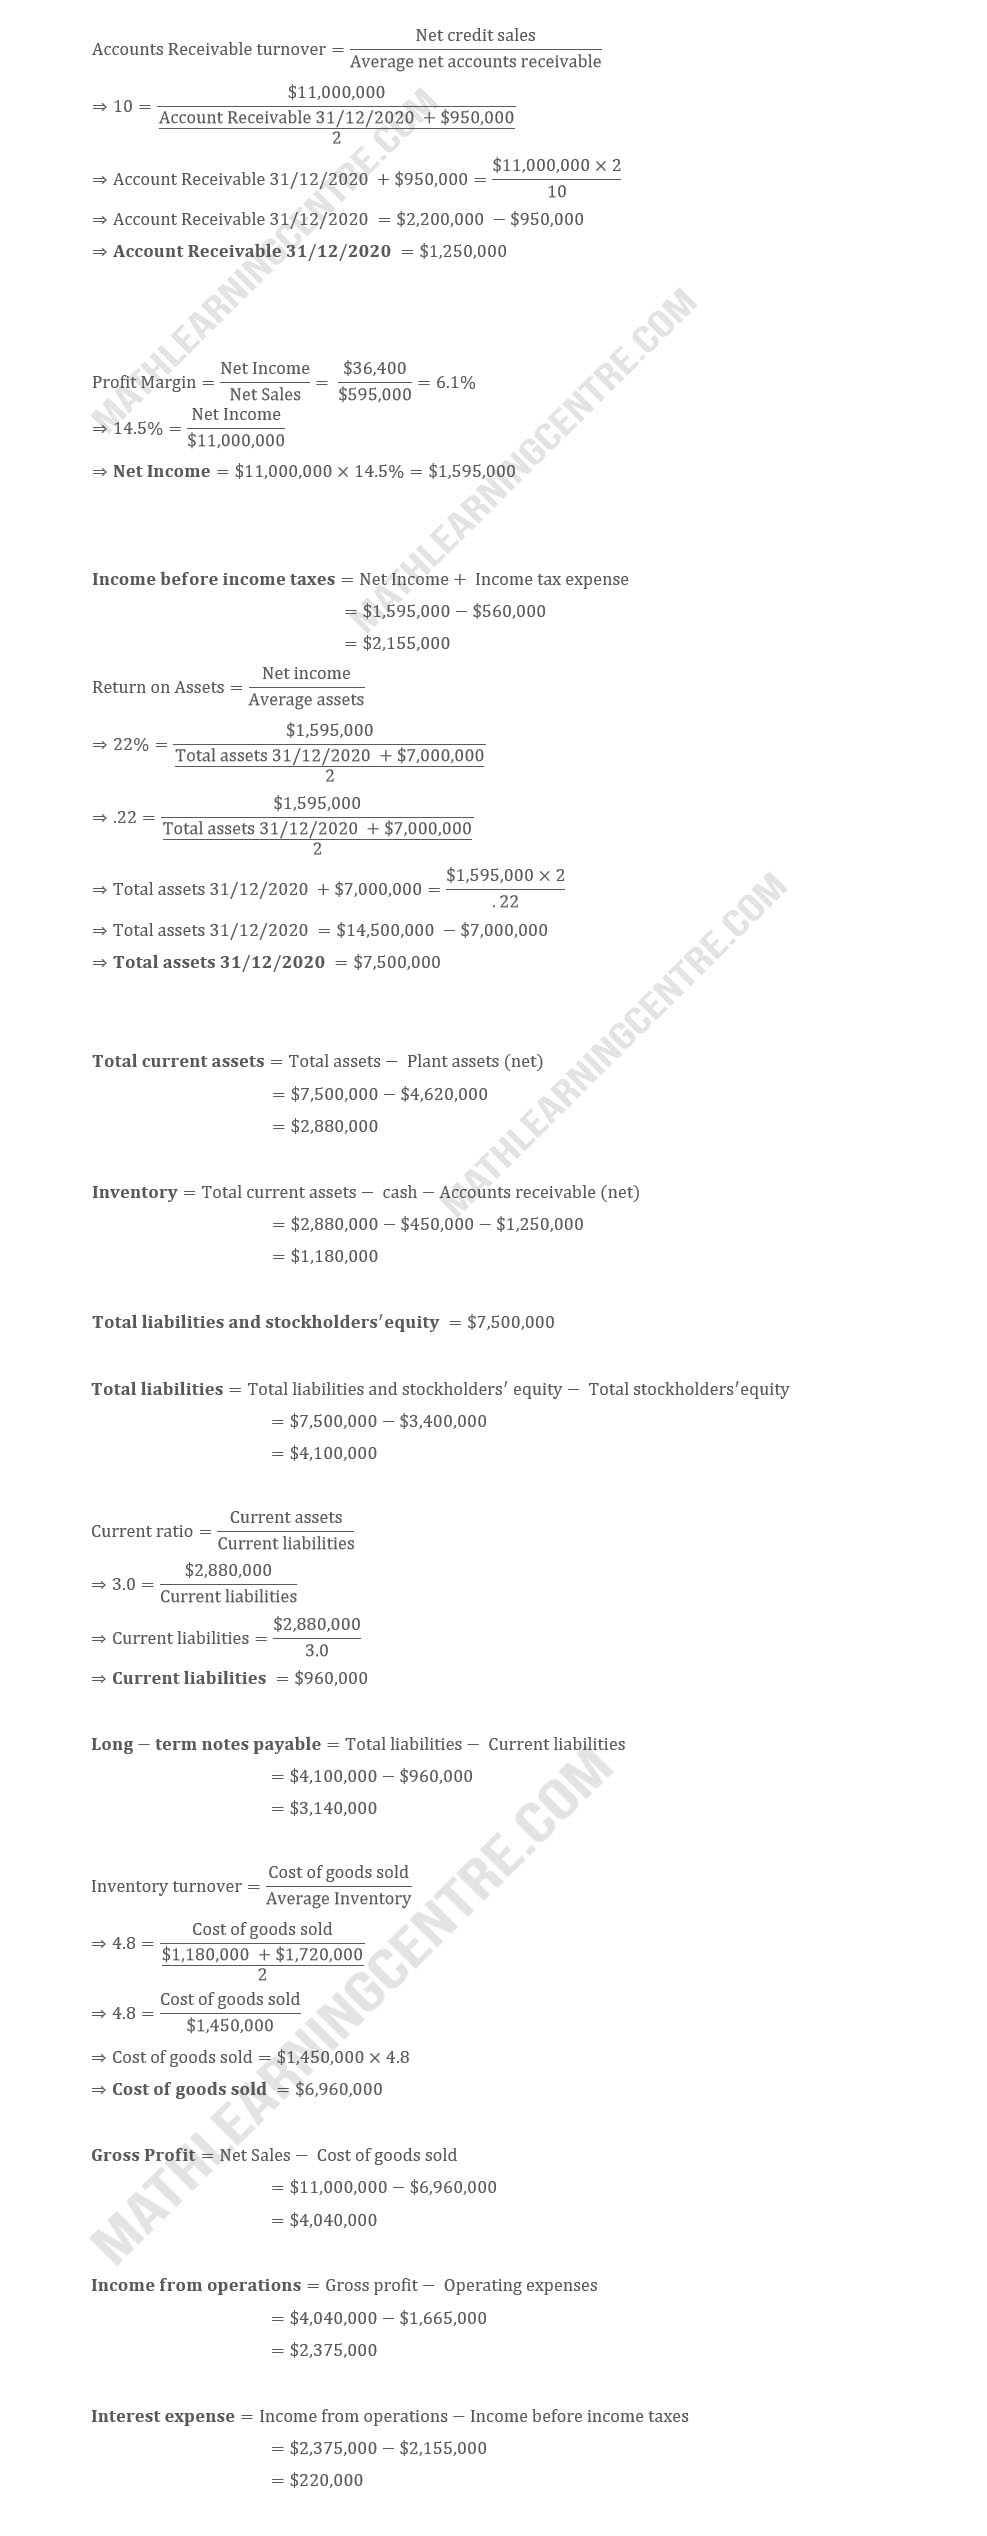
Solution
Computation of missing information.
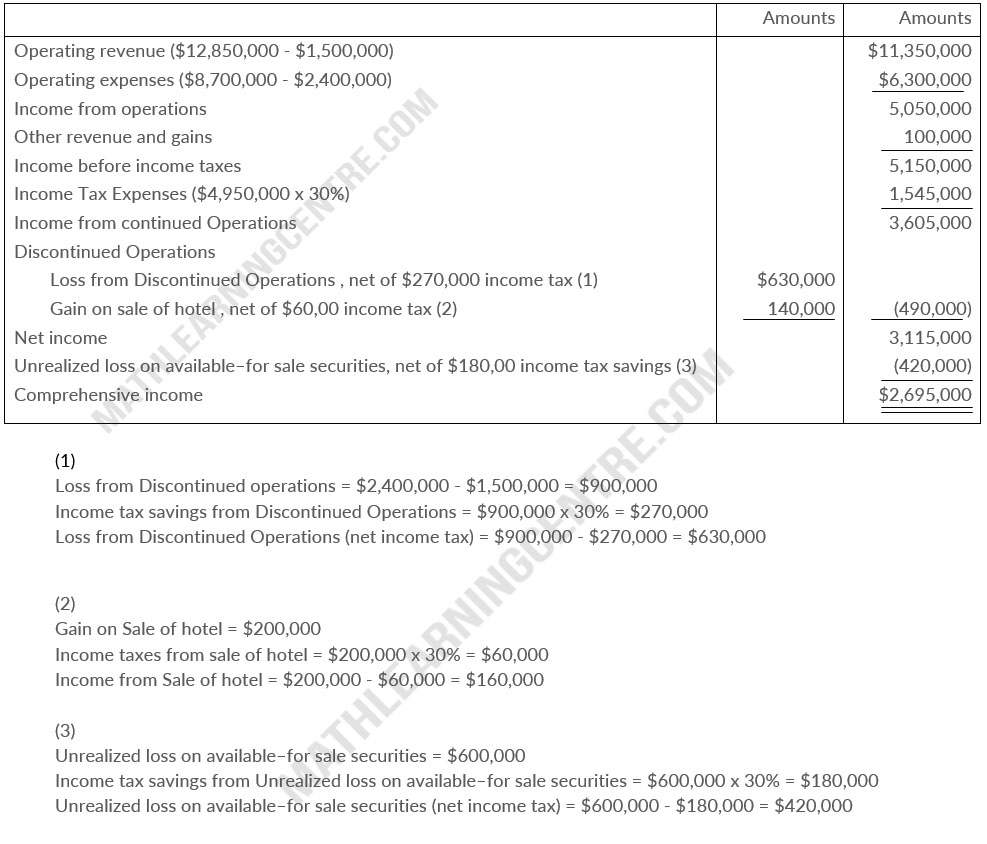
Terwilliger Corporation owns a number of cruise ships and a chain of hotels. The hotels, which have not been profitable, were discontinued on September 1, 2020. The 2020 operating results for the company were as follows.

Analysis discloses that these data include the operating results of the hotel chain, which were operating revenues $1,500,000 and operating expenses $2,400,000. The hotels were sold at a gain of $2,00,000 before taxes. This gain is not included in the operating results. During the year., Terwilliger had an unrealized loss on its available-for-sale securities of $600,000 before taxes, which is not included in the operating results. In 2020, the company had other revenues and gains of $100,000, which are not included in the operating results. The corporation is in the 30% income tax bracket.
Instructions
Prepare a statement of comprehensive income.
Solution
Terwilliger Corporation
Statement of Comprehensive Income
Statement of Comprehensive Income
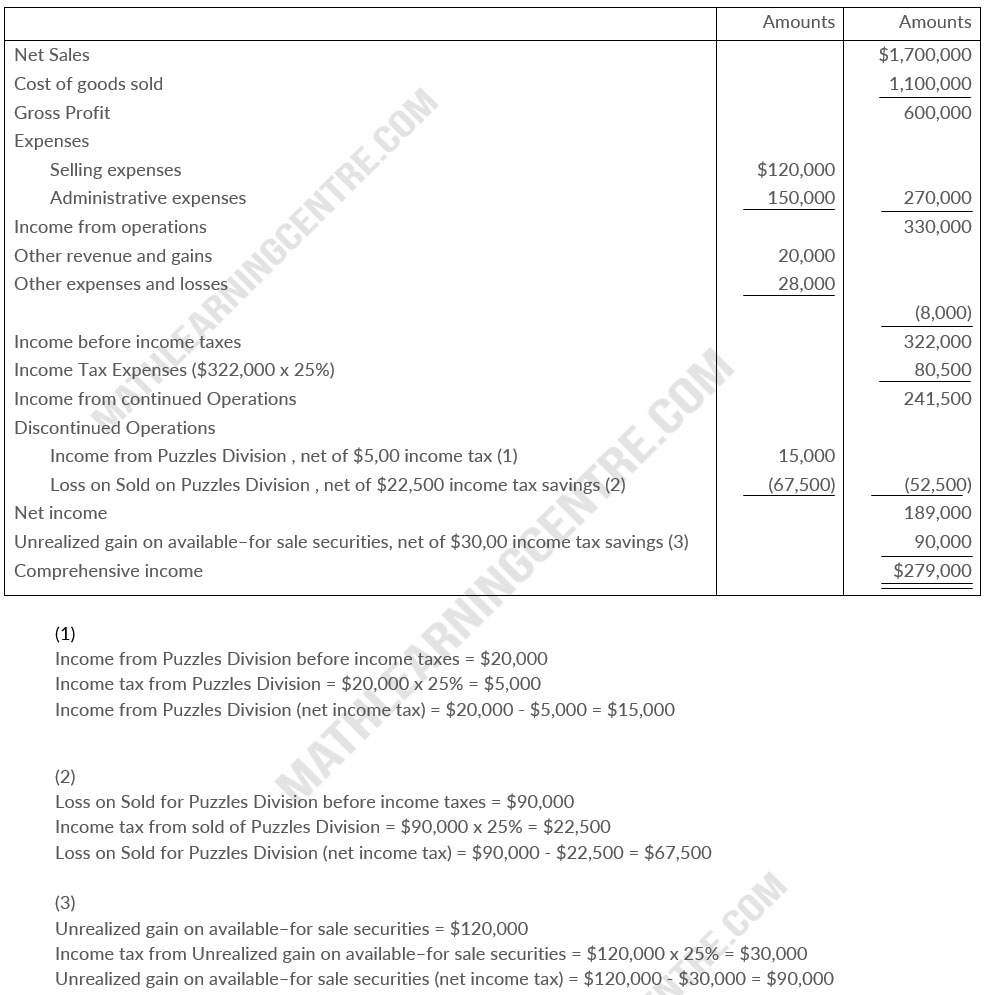
The ledger of Jaime Corporation at December 31,2020, contains the following summary data.
Your analysis reveals the following additional information that is not included in the above data.
- The entire Puzzles Division was discontinued on August 31. The income from operation for this division before income taxes was $20,000. The Puzzles Division was sold at a loss of $90,000 before income taxes.
- The company had an unrealized gain on available-for-sale securities of $120,000 before income taxes for the year.
- The income tax rate on all items is 25%;
Instructions
Prepare a statement of comprehensive income for the year ended December 31, 2020.
Solution
Jaime Corporation
Statement of Comprehensive Income
For the Year Ended December 31, 2020
Statement of Comprehensive Income
For the Year Ended December 31, 2020
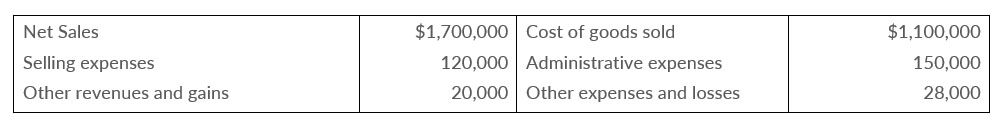
Financial information for Kurzen Inc. is presented below.
Instructions
Prepare a schedule showing a horizontal analysis for 2020 using 2019 as the base year

Minhajur Rahaman
