Before constructing a dam on the Colorado River, the U.S. Army Corps of Engineers performed a series of tests to measure the water flow past the proposed location of the dam. The results of the testing were used to construct the following frequency distribution:
| River Flow (Thousands of Gallons per Minute) | Frequency |
| 1,001–1,050 | 7 |
| 1,051–1,100 | 21 |
| 1,101–1,150 | 32 |
| 1,151–1,200 | 49 |
| 1,201–1,250 | 58 |
| 1,251–1,300 | 41 |
| 1,301–1,350 | 27 |
| 1,351–1,400 | 11 |
| Total | 246 |
- Use the data given in the table to construct a “more-than” cumulative frequency distribution and ogive.
- Use the data given in the table to construct a “less-than” cumulative frequency distribution and ogive.
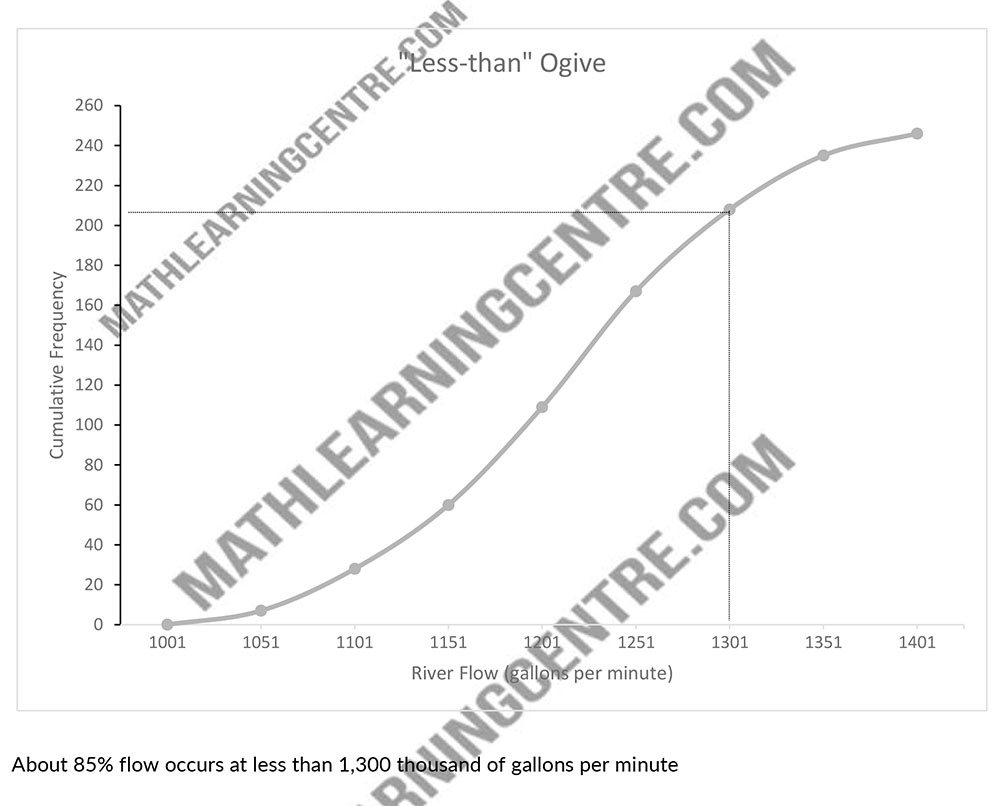
- Use your ogive to estimate what proportion of the flow occurs at less than 1,30
thousands of gallons per minute. Solutions
a.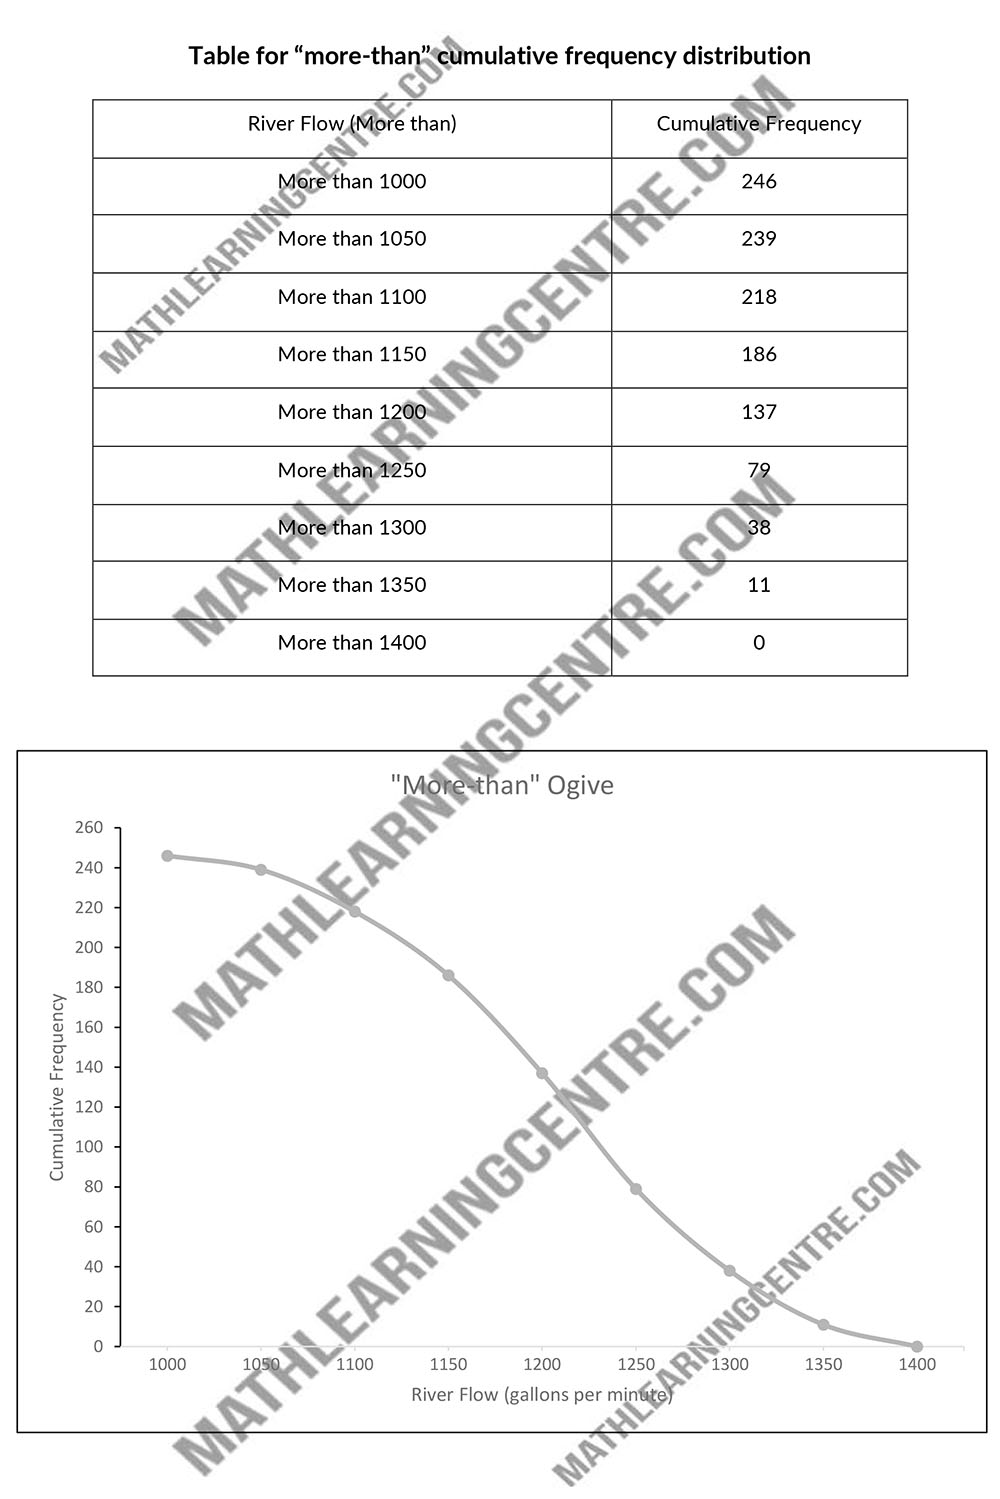 b.
b.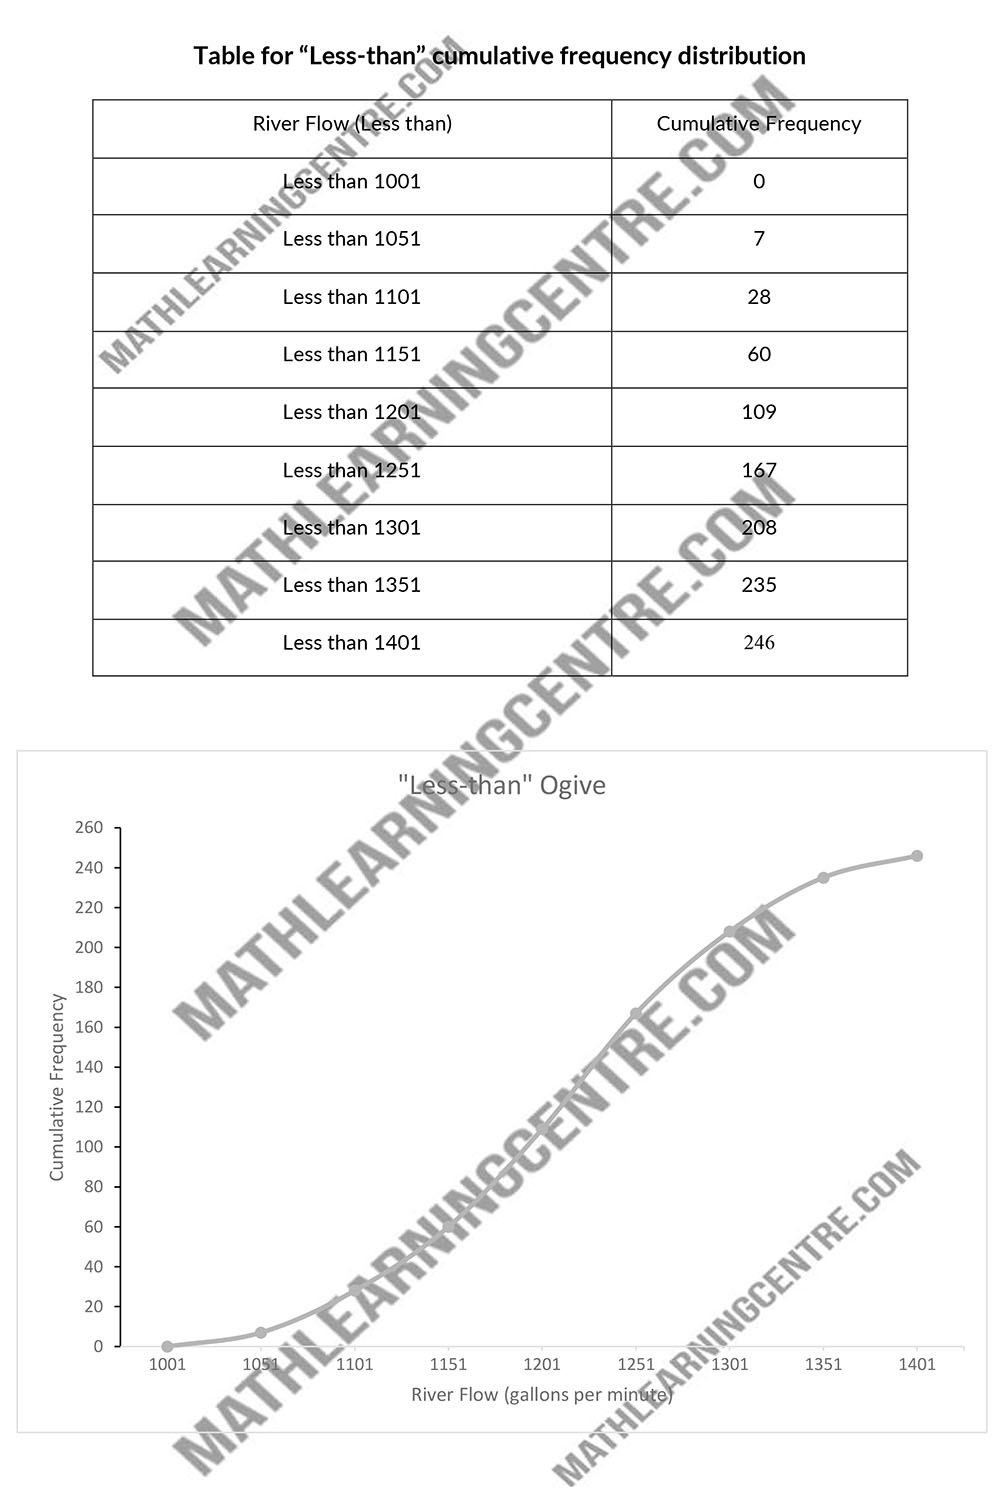 c.
c.