The Frequency distributions below represents the time in seconds needed to serve a sample of customers by cashiers at Bulls Eye Discount Store in December 1996.
| Time (in seconds) | Frequency |
| 20–29 | 6 |
| 30–39 | 16 |
| 40–49 | 21 |
| 50–59 | 29 |
| 60–69 | 25 |
| 70–79 | 22 |
| 80–89 | 11 |
| 90–99 | 7 |
| 100–109 | 4 |
| 110–119 | 0 |
| 120–129 | 2 |
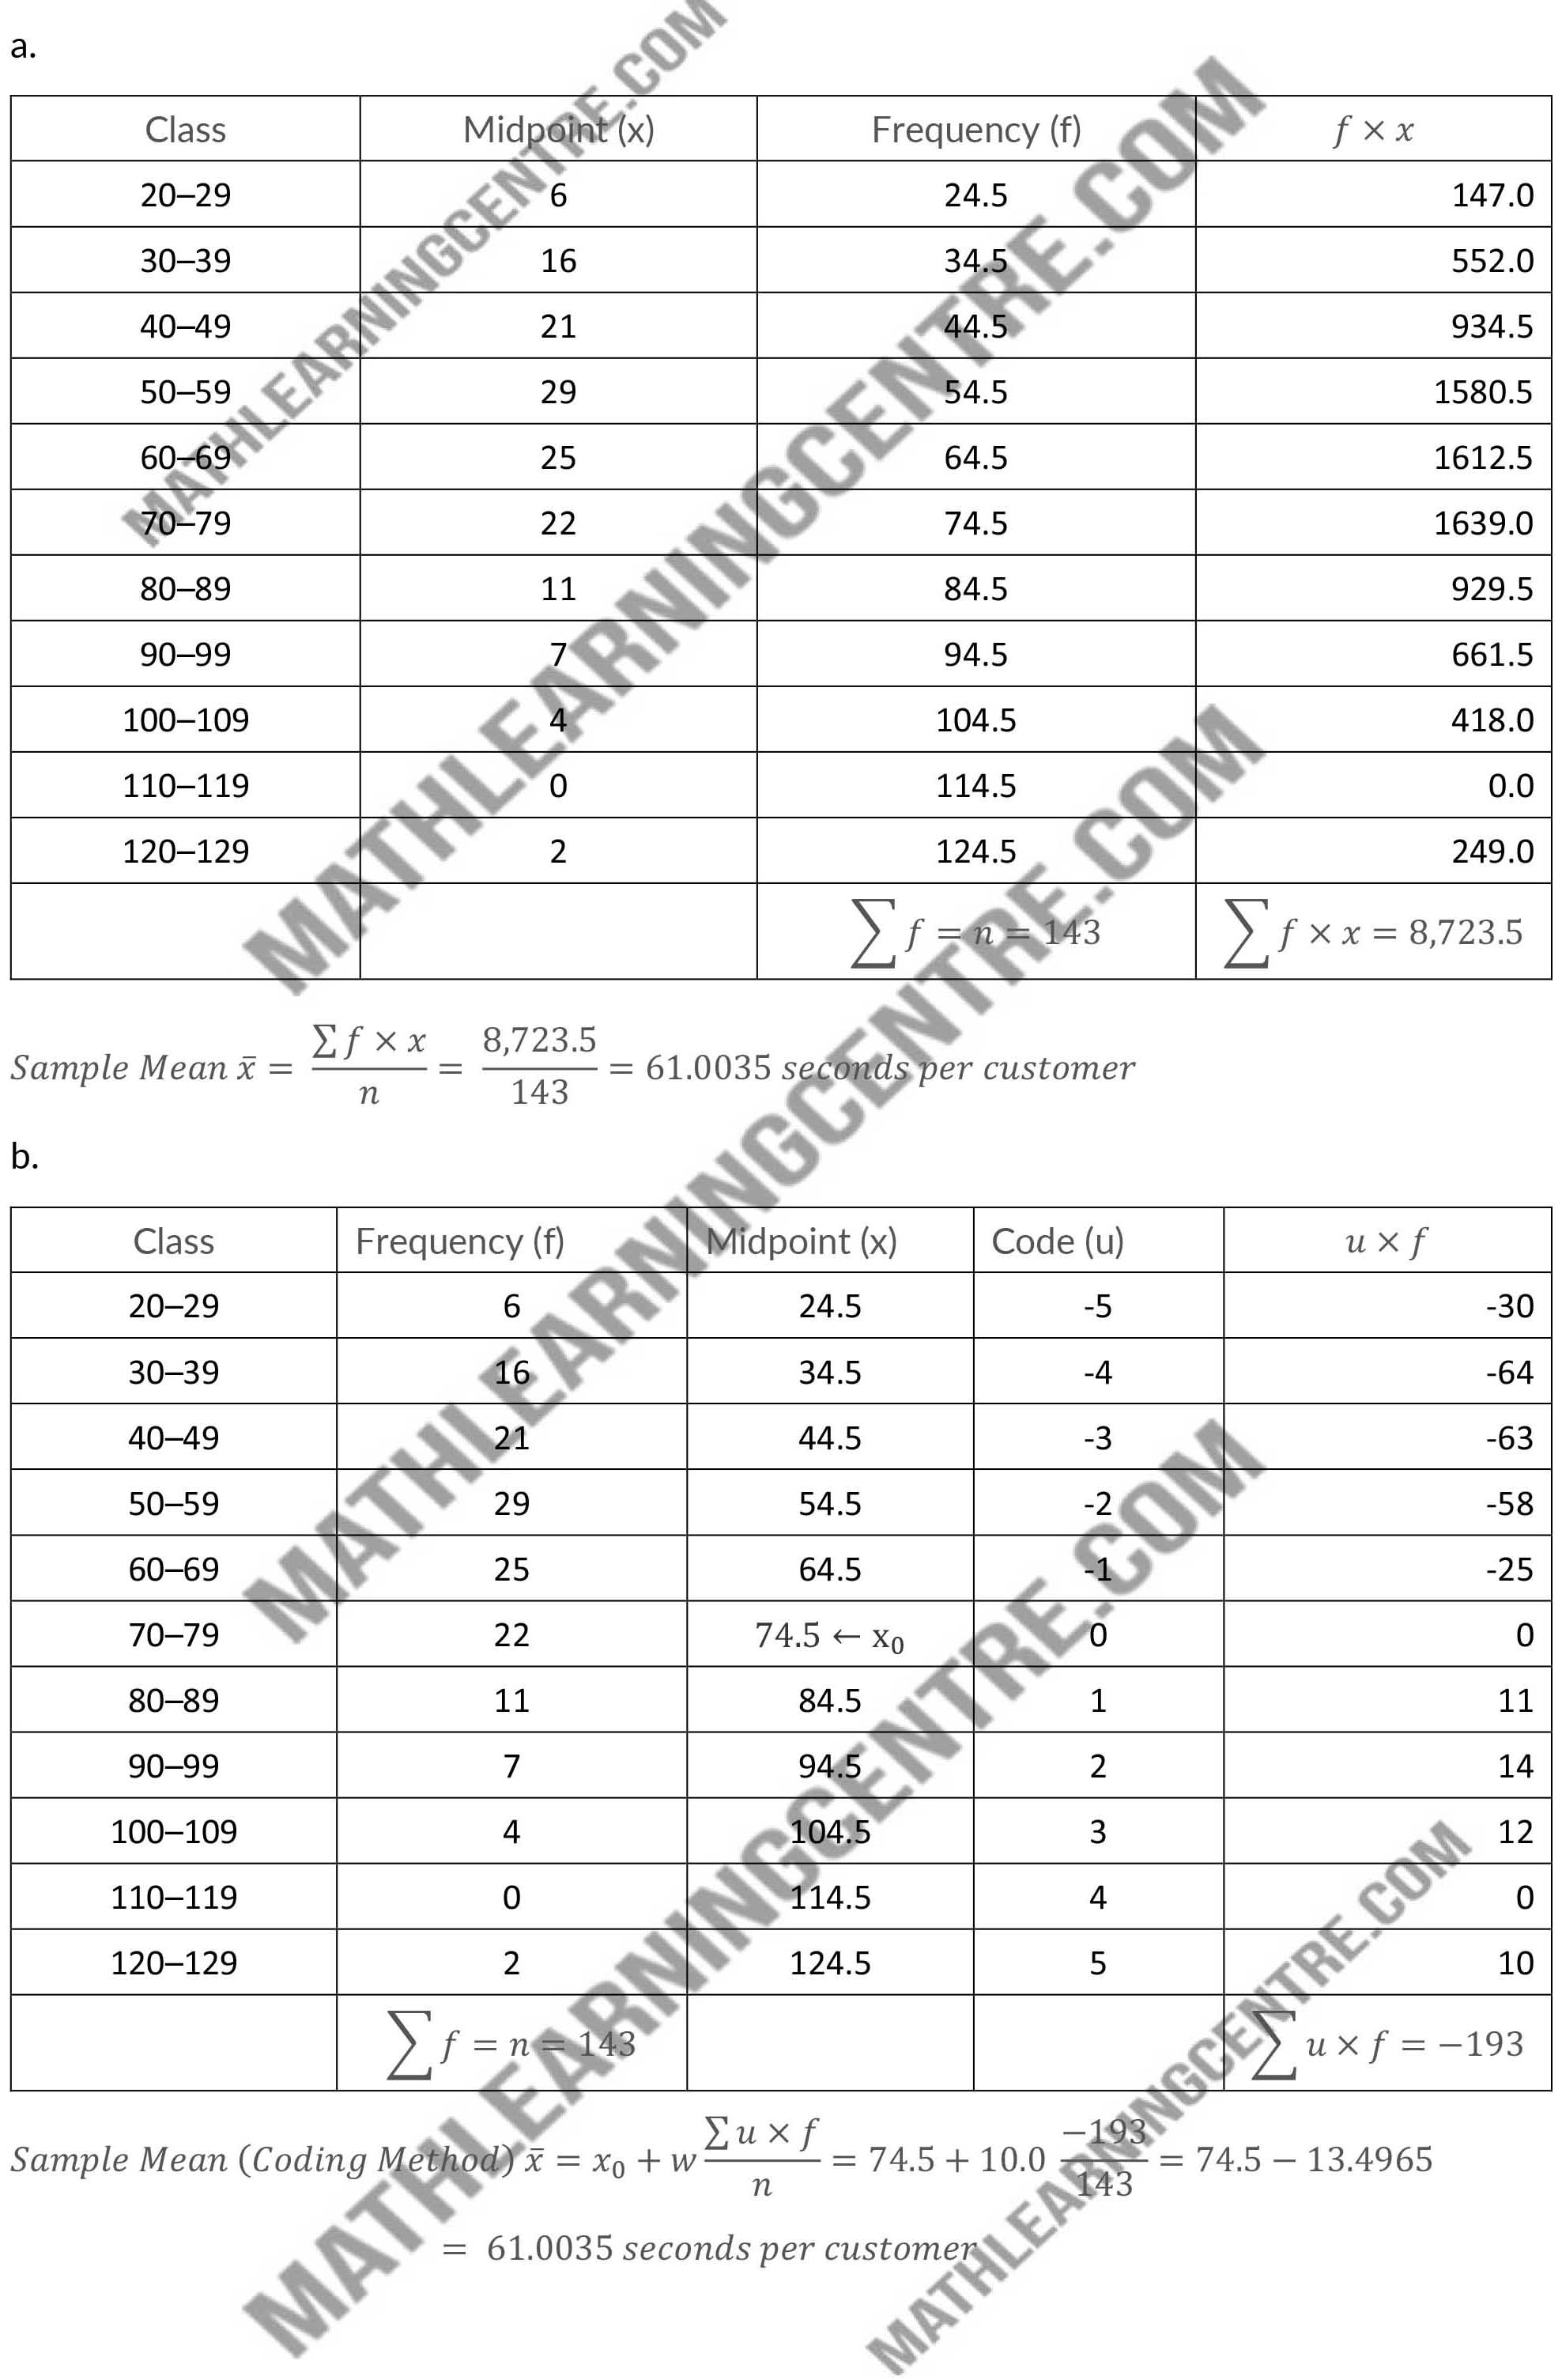
- Compute the sample mean
- Compute the sample mean using the coding method with 0 assigned to the 70–79 class.
Solution