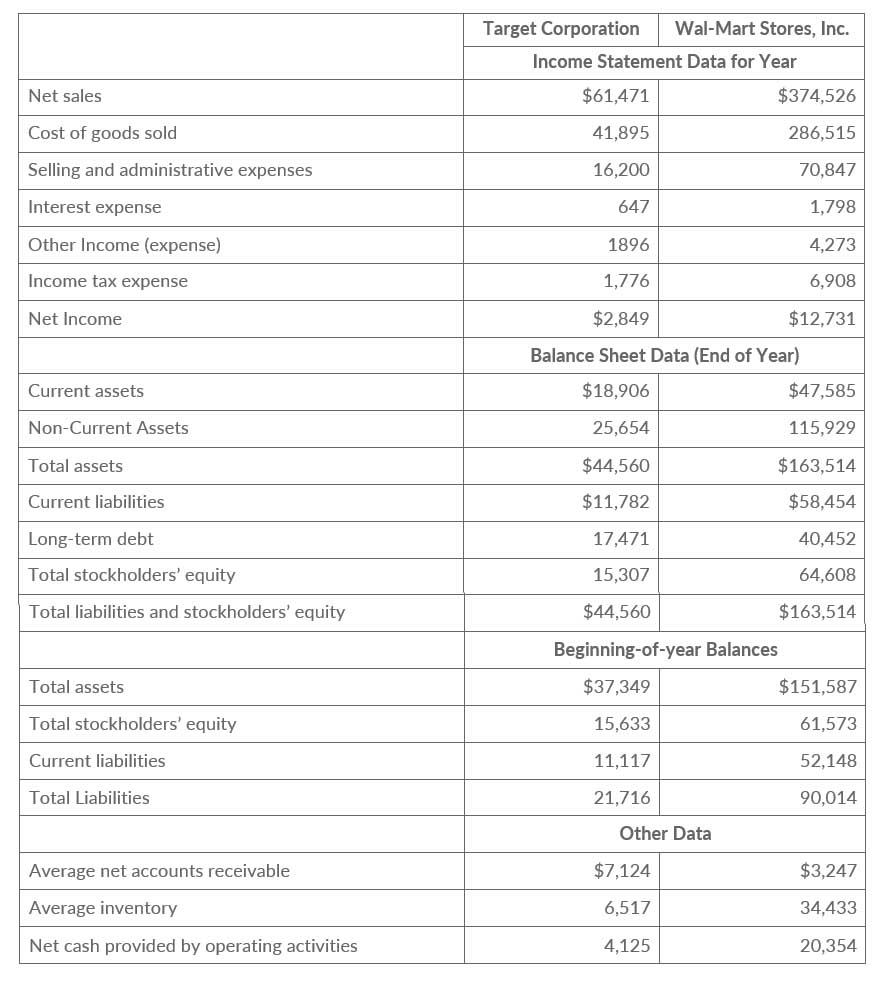
Selected financial data of Target Corporation and Wal-Mart Stores, Inc. for a recent year are presented here (in millions)
Instructions
- For each company, compute the following ratios.
- Current.
- Receivables turnover.
- Average collection period.
- Inventory turnover.
- Days in inventory.
- Profit margin.
- Asset turnover.
- Return on assets.
- Return on common stockholders' equity.
- Debt to total assets.
- Times interest earned.
- Compare the liquidity, profitability, and solvency of the two companies.
a. Computation of the Ratios.
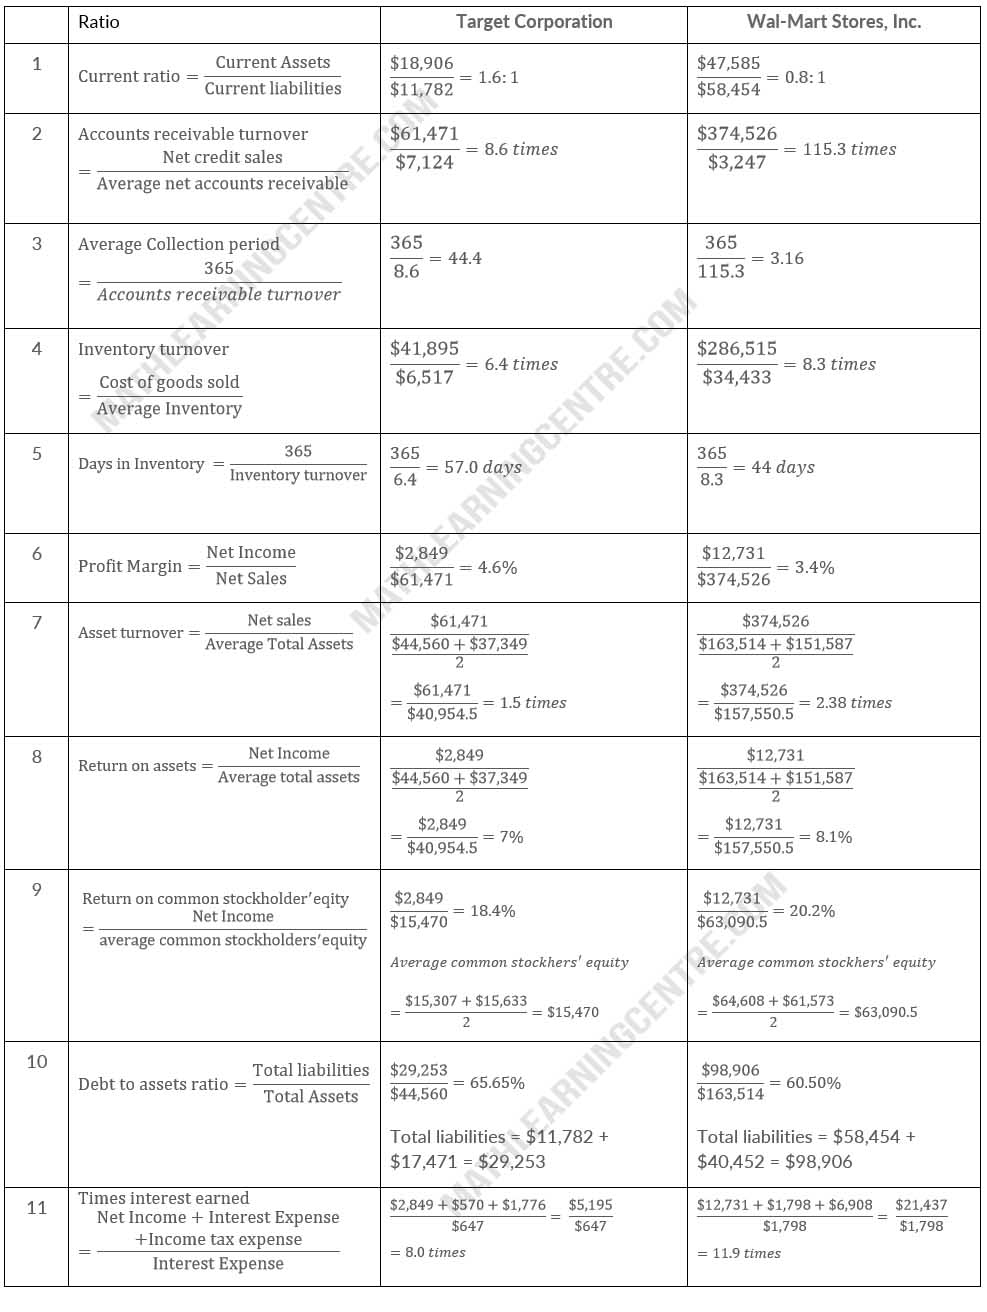
b.
The comparison of the two companies shows the following:
Liquidity: Target's current ratio of 1.6:1 is significantly better than Wal-mart's .8:1. But Wal-mart inventory turnover and Accounts receivable turnover are better than Target's.
Profitability All of the profitability ratios except profit margin of Wal-mart's are better than Target's so that Wal-mart's is more profitable than Target's
Solvency: Both of the solvency ratios of Wal-mart's are better than Target's so that Wal-mart's is more solvent than Target's